There’s never a dull moment in equity markets. Even by lofty standards, in a matter of weeks, 2025 has already distinguished itself. We’ve seen the long-awaited ceasefire in Gaza. The announcement of tariffs on Canada and Mexico, only to see them suspended before they were even rolled out. Tariffs on China announced and then countered by China. In the US, President Trump has voiced his intent to take over the Panama Canal, Greenland, and even the Gaza Strip.
Lastly, investors won’t forget the ripples caused by DeepSeek, challenging some accepted notions around AI, casually wiping out around US$700 billion in market value off Nvidia in the process1. This list is just the tip of the iceberg, with countless other headlines grabbing people’s attention. And all before the end of January.
With all this noise in markets, global investors might be reviewing their strategies and wondering, what’s next?
While we can’t predict the future, allow me to share how I’m viewing the market and the key challenges and opportunities that lie ahead.
Batting averages suggest it’s time to reset expectations
Off the back of two big years – with the S&P 500 Index up more than 60% on a cumulative basis over 2023 and 2024 – investors will need to be mindful that this has been a relatively rare investing phenomenon.
In fact, in the last 95 years (1,140 months since December 1929), there have been only 56 monthly instances where the previous 24 months have delivered cumulative returns greater than 60%.2 In other words, that happened only around 5% of the time in 95 years. Bear in mind, this includes a long string of consecutive positive months in the late 1990s when the dotcom bull market was in full swing. In fact, 18 of those 56 instances took place between 1996 and 1999.
When we look at those occasions with returns greater than 60% in the previous 24 months, the average return for the following 12-month period has averaged only 0.08% – basically zero. Take it a step further and exclude the time periods of the roaring dotcom bull market (1996 – 1999), and the average return for the following 12-month period drops to - 9.15%. This is not to say that 2025 is destined to be a disaster; after all, we did see multiple back-to-back strong years in the late 1990s. However, using history as a guide, based on returns in global markets over the last two years, 2025 might prove to be lacklustre.
As things stand, consensus expectations for 2025 earnings-per-share (EPS) growth, which measures company profitability, for the MSCI World Index are around 11% vs CY2024.3 There is a historical tendency for earnings estimates to start off a little more on the optimistic side and then drift down as the year goes on. Allowing for some slippage from here, earnings growth could still be in the region of high single digits, if there is no recession.
No alarm bells ringing, for now
Are there any signals that a recession is looming around the corner? In short, no. If we take a quick look at three useful macroeconomic indicators, we can see that there are no real alarm bells ringing right now.
Looking at the Citi Surprise Index (Figure 1), it remains above zero for both the US and global regions, indicating economic performance is generally ahead of expectations. A reading above zero indicates more positive surprises than negative surprises are being experienced, and vice versa.
Figure 1. World – Citi Surprise Index
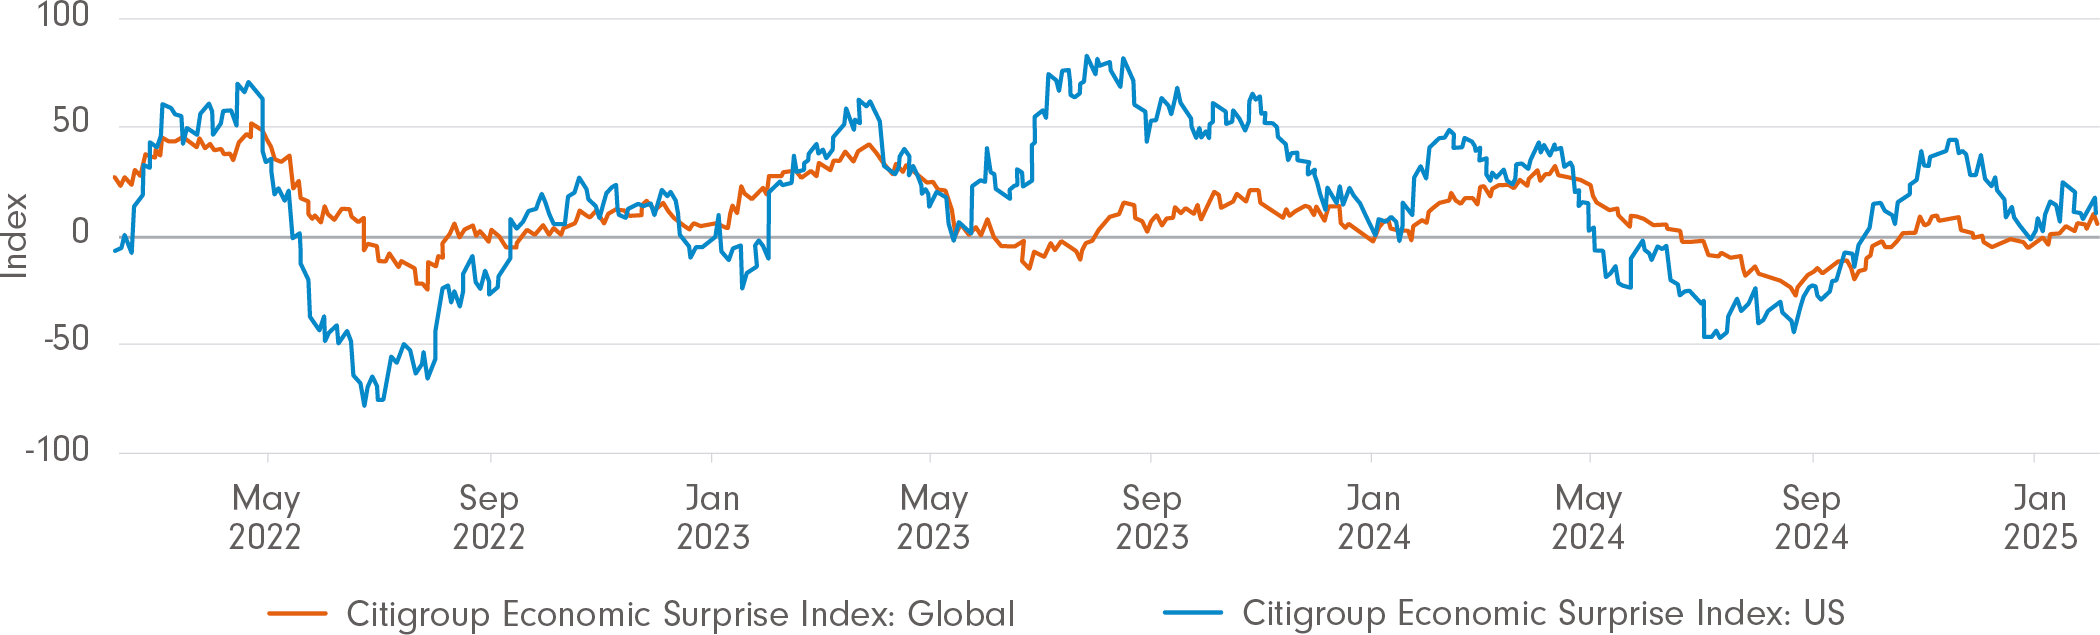
Source: MacroMicro
The Conference Board Measure of CEO Confidence in the US (Figure 2) is still measuring above 50, and this typically drops to 45 or lower immediately ahead of recessions. As we stand, CEO confidence in the US hasn’t dropped to levels typically associated with a recession.
Figure 2. The Conference Board Measure of CEO Confidence
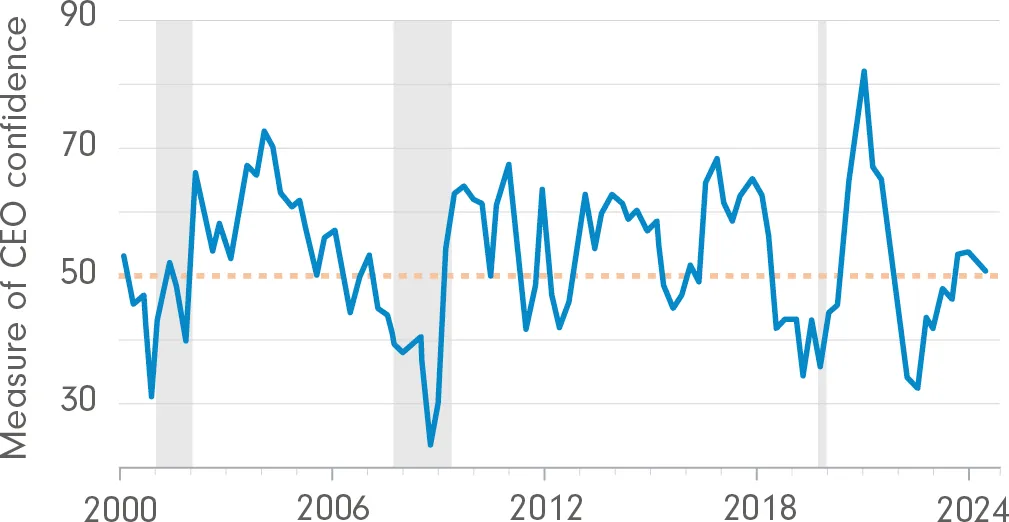
Shaded areas represent periods of recession.
Source: The Conference Board
Finally, the Conference Board Consumer Confidence Index also sits pretty. In Figure 3, we see the Present Situation Index (blue) is sitting at a relatively high level from a historical perspective, and the Expectations Index (orange) is currently above 80, which is historically a threshold that, when breached, can be an initial indicator of a pending recession.
Figure 3. Present Situation and Expectations Index
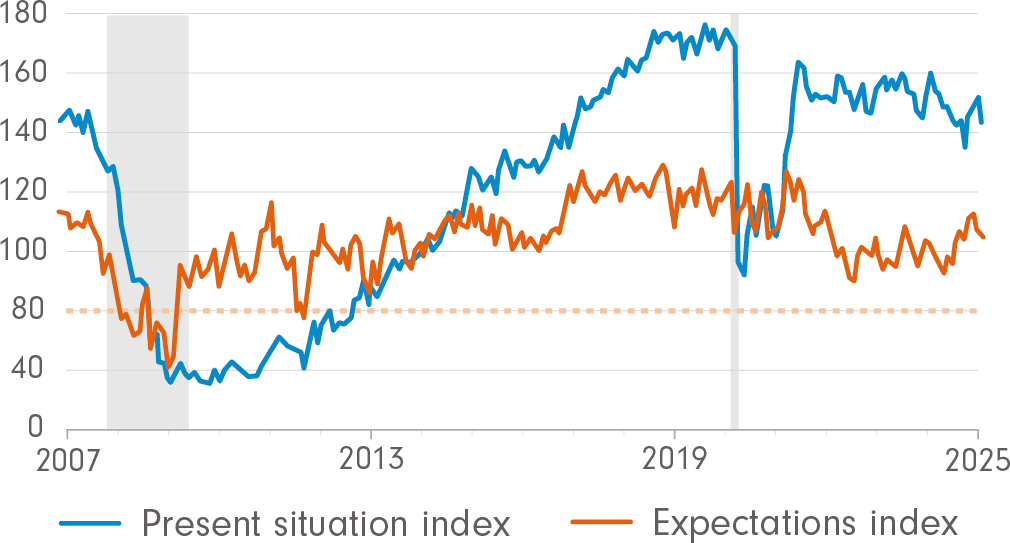
Shaded areas represent periods of recession.
Source: The Conference Board. © 2025 The Conference Board. All rights reserved.
Future expectations indicate a more subdued outlook
Let’s now put some numbers into potential return expectations for global markets for the year ahead, using a framework of assumptions. One way to view returns to equity investors is the sum of the following:
- Changes in EPS, plus
- Changes in the price-to-earnings (P/E) valuation multiple, plus
- Dividend yield
Now let’s use this equation with a hypothetical scenario. If I use the 11% EPS growth forecast for the MSCI World Index in 2025, as mentioned earlier, and account for a hypothetical buffer of a 3% reduction in earnings as the year progresses, I can use an EPS growth number of around 8%. EPS is a key component of the P/E valuation ratio.
I can then take an expected current dividend yield of 1.7% for the MSCI World Index and finally, account for any changes to the P/E multiple. This is the most volatile – and the most difficult-to-predict – component, due in part to being influenced by ‘animal spirits’, or investor sentiment, and is often the most prominent driver of returns. Looking at the historical P/E multiples for the MSCI World Index in Figure 4 below, we see a sombre picture.
Figure 4. MSCI World Index
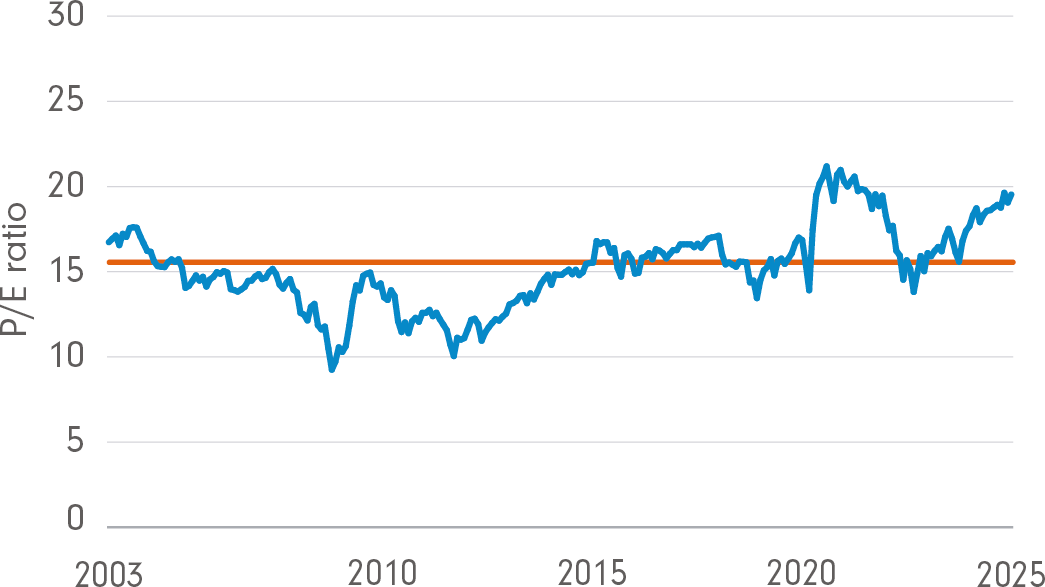
Source: FactSet, FIL
With a P/E ratio of almost 20 (as indicated on the y-axis), the MSCI World Index is currently trading well above its long-term average of just over 15 x, and near some of its all-time highs, set during the pandemic when central bank interest rates were at or near zero. This naturally creates much more downside risk than upside. While this helped drive strong equity performance over the past two years, I don’t think it’s wise or prudent to expect a positive contribution from this component. If P/E multiples hold flat in 2025, I expect an 8% contribution from EPS growth and 1.7% contribution from the dividend yield, giving us almost 10% total return for the year in this scenario.
However, if we see a compression in the P/E multiple, hypothetically down to 18 x (still higher than the long-term average), then I would expect a total return of around 2% for the year. Similarly, a potential compression in the P/E multiple down to 17 x (from the current 19.5 x) could see returns going into negative territory.
With history not on our side, combined with risks of P/E multiple compression, my lacklustre outlook on returns shared earlier continues to seem most likely. Therefore, I believe a good ballpark for returns for global investors could be somewhere between –10% and +10% for the year – a far cry from the lofty highs of the past two years.
Look beyond the big end of town for opportunity
That being said, what if there are pockets of the market that appear more attractive than the whole? If I look at the mid-cap space, and repeat the exercise, I get a different picture:
- Consensus estimates for 2025 EPS growth for the MSCI World Midcap Index are around 12.7%.3 Again, let’s handicap this number to account for the typical downgrades that take place throughout the year, and for this scenario we will use 9%.
- The dividend yield presently is 1.9%.1
This means that before I consider any changes to P/E valuation multiples, the MSCI World Midcap Index is hypothetically sitting at almost 11% total returns for the year. That is slightly higher than the estimated 10% for the MSCI World Index at the same point in the equation.
Figure 5. MSCI World Midcap Index
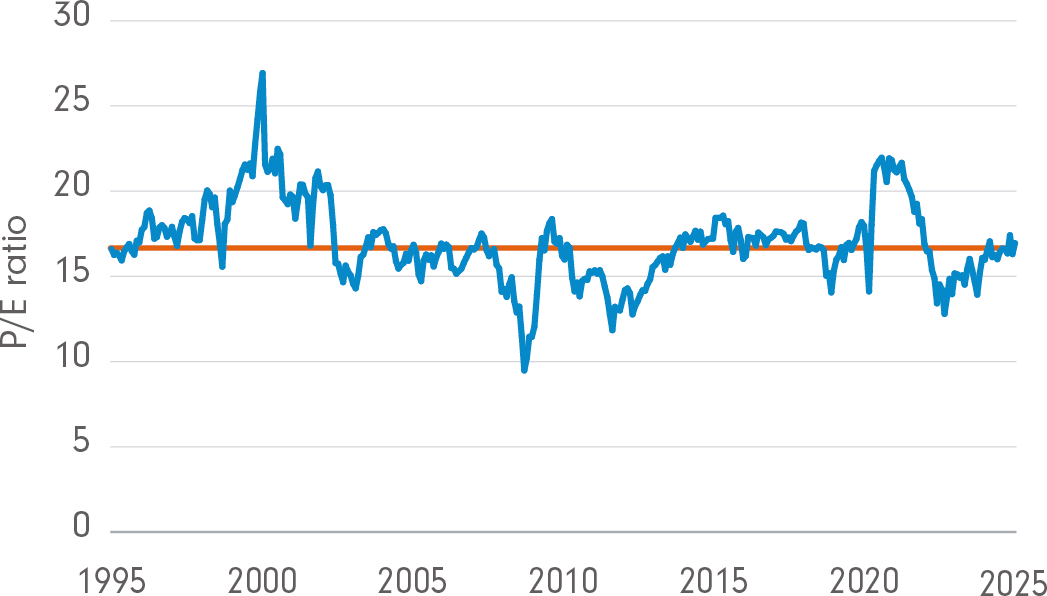
Source: FactSet, FIL
This is where things start to get interesting. As you can see from Figure 5, the MSCI World Midcap Index is presently trading at almost 17 x P/E, which is comfortably cheaper than the broad cap index. It’s also trading at levels in line with its 30-year historical average, and significantly below its all-time highs. While I’m not going to predict what is going to happen to P/E multiples from here, it seems considerably more likely that the midcap index has room to move higher, or alternatively, less room to fall, as compared to the broad cap index, which is already priced well above historical averages.
New winners will emerge
Last, but not least, we will need to identify new winners in the rapidly changing geopolitical landscape. While Mexico and Canada have evaded tariffs, for now at least, China hasn’t been spared. We don’t know which country or region will be next, but it seems likely global trade will continue to be a casualty under the new US Administration.
This is an opportunity for investors to consider domestically focused businesses with ‘less to lose’ from a global trade war. Mega-cap companies with revenues across multiple regions of the world may find this harder to manage, given part of their success has been from global dominance.
Look beyond the headlines
Despite all the noise, we feel there is a compelling opportunity set in global small and mid-cap companies – based on their current valuations, returns expectations, and with less sensitivity to geopolitical noise.
Our thinking aligns with our Global Macro & Strategic Asset Allocation team who, from a macro perspective, are also very positive on the midcap space, especially in the US. They see strong fundamentals continuing to drive US exceptionalism, preferring more domestically focused business for the reasons I described earlier.
Looking ahead, investors may need to reset their expectations and look beyond the mega–cap darlings of 2023 and 2024 for opportunities, as we expect 2025 will paint a different picture.
Sources:
1. FactSet.
2. Bloomberg; FIL.
3. FactSet consensus estimates retrieved on 7 February 2025.